
Proceedings of the Seventh Annual UW GIS Symposium: Comparing Rail Transit in Seattle, WA and Singapore

Proceedings of the Seventh Annual UW GIS Symposium
Comparing Rail Transit in Seattle, WA and Singapore
    • Notifications
    • Privacy
  • Project HomeUniversity of Washington GIS Symposiums
  • Projects
  • Learn more about Manifold

Notes

Show the following:

  • Annotations
  • Resources
Search within:

Adjust appearance:

  • font
    Font style
  • color scheme
  • Margins
table of contents
  1. Title Page
  2. Contributors
  3. Contents
  4. Preface
  5. Keynote
  6. Short Talks
    1. Farewell Victoria: Quantifying the Value of Foreign Names
    2. Potential Location Assessment of Current and Estuarine Surveys (PLACES) for the National Oceanic and Atmospheric Administration (NOAA)
    3. Temporal Tensions in Digital Story Mapping for Housing Justice: Rethinking Time and Technology in Community-Based Design
    4. Reducing Customs and Border Protection's 100-Mile Enforcement Zone in Washington State
    5. Comparing Rail Transit in Seattle, WA and Singapore
    6. Habit Fragmentation Via Roads in King County
    7. Changes to the Shoreline of Mud Bay, Bellingham, Washington

Comparing Rail Transit in Seattle, WA and Singapore

Crystal Tan, Geography

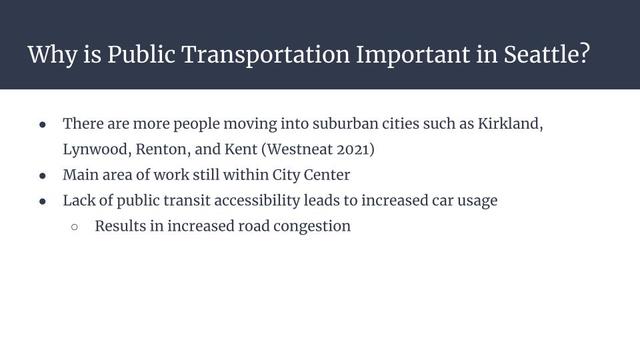
For one of the undergraduate geography courses I took in the department (GEOG 317), I created a final project analyzing rail transit in Seattle and compared it to rail transit in Singapore. In this final project, I created some static visualizations using R and interactive webmaps using ArcGIS Pro. These visualizations, along with the research, methodology, and analysis were then published in an ArcGIS StoryMap. To compare the two rail transit systems, I measured each rail system's centrality using network analysis and accessibility using area and buffer analysis. Using network analysis, I described the centrality of each rail system by counting nodes and edges along with looking at connectivity. Using buffer analysis, I recorded the area within 0.5 miles from each rail station and determined how accessible these stations were by looking at how many pharmacies are within the 0.5 mile buffers. Link to ArcGIS StoryMap: https://storymaps.arcgis.com/stories/15d18c9f15554083963b7bbe8fad52c7

A slide from this presentation detailing why public transit is important in Seattle, identifying reasons such as: increased movement into nearby suburbs, and the main area of work still being concentrated in the city center.

Annotate

Next Chapter
Habit Fragmentation Via Roads in King County
PreviousNext
Powered by Manifold Scholarship. Learn more at
Opens in new tab or windowmanifoldapp.org